BIMBEATS STUDIO

ENTERPRISE-LEVEL DATA ANALYTICS FOR SMALL FIRMS

Bimbeats Studio is a lightweight version of Bimbeats for firms under 50.
Simply install, and we'll deliver the insights.

What Studio shows you

Three sources of data to tell the story of your digital footprint
Revit Models

Model health and activity at a glance

Spot slow models, targeted cleaup, and inform training

Revit Models

Model health and activity at a glance

Spot slow models, targeted cleaup, and inform training

Program Use

Accurate license counts across all your programs

Bimbeats metric gauge visualization representing custom dashboards and alerts for architecture and engineering metrics. Offers turnkey dashboards for BIM performance, model health, license use, with ability to tailor alerts for specific workflows and risk thresholds.

Workflow Insights

Program Use

Accurate license counts across all your programs

Bimbeats metric gauge visualization representing custom dashboards and alerts for architecture and engineering metrics. Offers turnkey dashboards for BIM performance, model health, license use, with ability to tailor alerts for specific workflows and risk thresholds.

Workflow Insights

Infrastructure

Spot lagging machines

Bimbeats metric gauge visualization representing custom dashboards and alerts for architecture and engineering metrics. Offers turnkey dashboards for BIM performance, model health, license use, with ability to tailor alerts for specific workflows and risk thresholds.

Fixed before it costs a deadline

Infrastructure

Spot lagging machines

Bimbeats metric gauge visualization representing custom dashboards and alerts for architecture and engineering metrics. Offers turnkey dashboards for BIM performance, model health, license use, with ability to tailor alerts for specific workflows and risk thresholds.

Fixed before it costs a deadline

Dashboards that fill themselves

Dashboards update in real-time and are are live automatically

Dashboards update in real-time and are are live automatically

Model Health

Tool Usage

Hardware Monitor
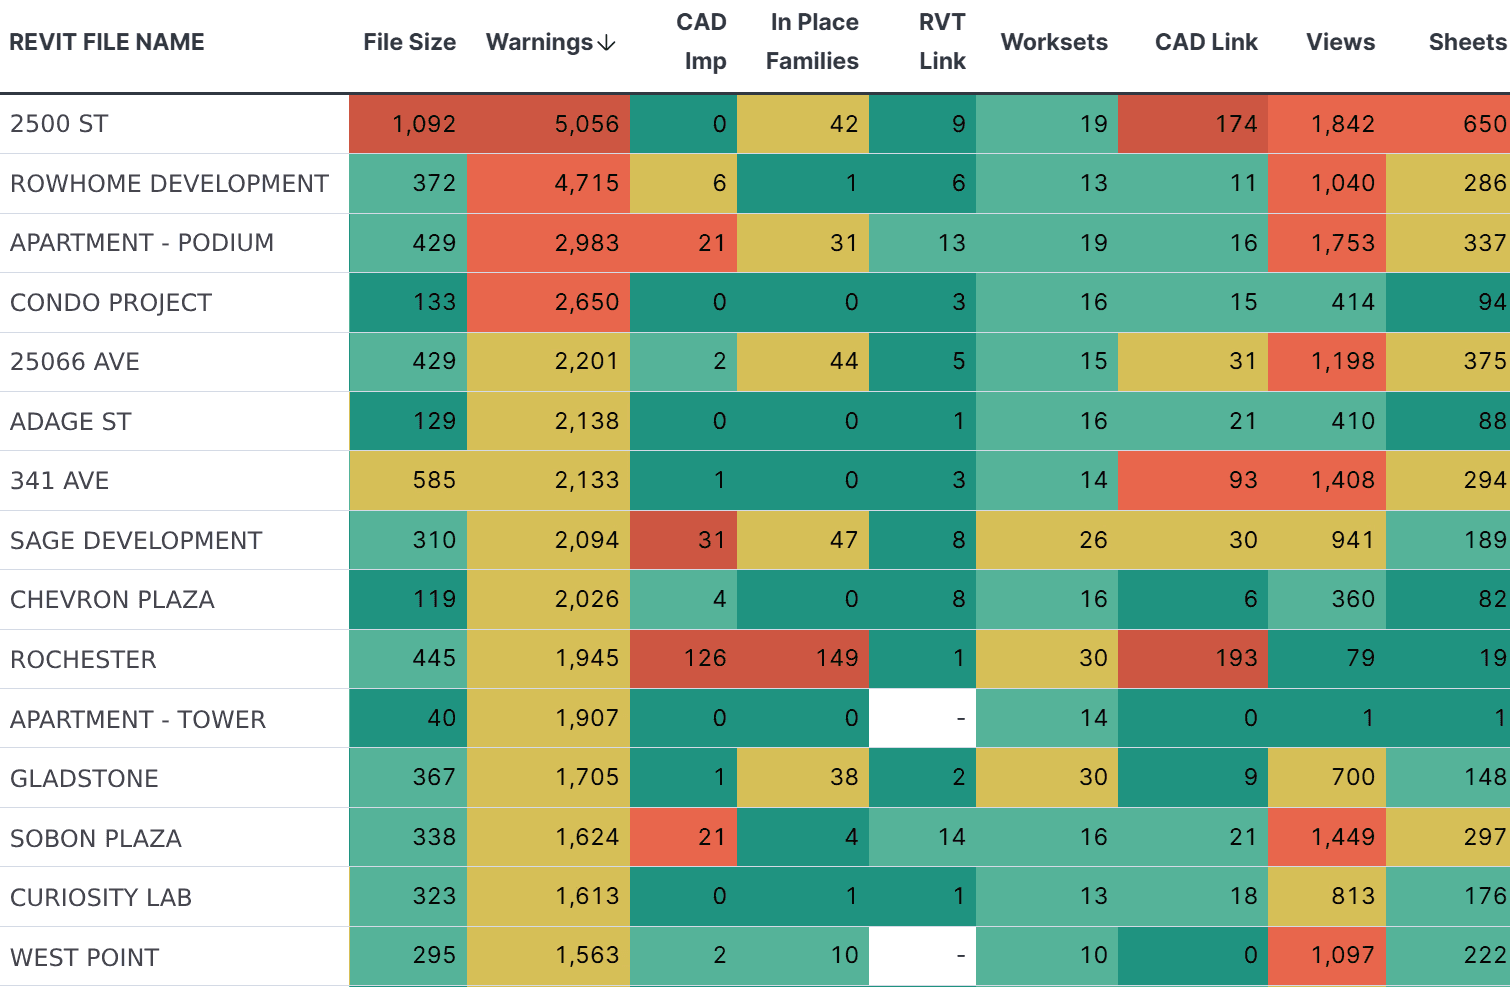
Bimbeats Revit model health analytics dashboard displaying active project models with key performance metrics—warnings, file size, CAD imports, in‑place families, worksets, links, views, sheets—color‑coded heatmap for risk detection. Designed for AEC workflow optimization and BIM model health monitoring.

Monitor model health at a glance

The average Revit user loses a full work-week every year just waiting for models to open.

Spot problem areas early with color-coded metrics that flag performance risks across your Revit models.

Click into any metric to explore trends over time and guide cleanup before issues grow.

Frictionless Setup

See the data flowing instantly

See the data flowing instantly

01

One installer for every machine

Deploy across all desired machines with a single installer. No need to configure a server, we'll take care of that.

02

Data starts flowing immediately

Revit activity, program usage and machine health start streaming the moment it's installed.

03

Dashboards update in real time

Live from day 1. Your web-based dashboards are always accessible and up to date.

04

Reports land in your inbox

Weekly and monthly reports are delivered automatically. Read, forward, done.

Automatic Reporting to Your Inbox

Automatic reporting with flags, insights, and recommendations. So you can focus on designing.

Long opening times can be due to interrupted startups.

Startup for this file was interrupted by the following popup:

| Revit could not find or read 2 references. What do you want to do?

— Revit Activity and Model Health Report

Warnings increased to 1,392 this period

The dominant type is "Could not create Wall Sweep." (880 instances).
Action: Schedule a warning-cleanup pass before the next issue.

— Model Intelligence Report

Swap Usage reached 94.1%

Heaviest processes around the peak: Enscape.RendererHost.exe (36.8 GB), Revit.exe (14.4 GB)
Action: The machine ran out of physical RAM and fell back to disk swap, which slows all programs. Check installed RAM capacity and background processes before considering an upgrade

— IT Audit

Pricing

Pricing

Pricing

One flat price for your entire team.

One flat price for your entire team.

Studio

Studio Trial

Bimbeats Studio brings the power of enterprise-level data analytics to small firms, delivering ready-to-use insights from week 1.

No server to commission or configure, no network ports to open.

Notes:


All prices in USD.

Data is hosted by Bimbeats, using Elastic Cloud.

Data collection is limited to Revit metrics, hardware monitoring, and program use.

Subscription includes:


Latest version of Bimbeats integrations.

Includes Training Session

Access to dashboards and reports

Single login for web-based visualizations

Bimbeats Studio

$4,000

per year

up to 49 machines

What changes with Studio

Your data in one place

Dashboards update automatically as you work

Weekly & monthly reports in your inbox

Time and money saved by monitoritong workflows

Insights from day one

without it

Scattered, unstructured data

Manual model audits

Slow models and machines silently kill productivity

Time and money lost to inefficient workflows

"Insights" based on gut feel

50 or more people? Lets talk about Bimbeats Enterprise

More sources of data, customizable dashboards, your own infrastructure.

Schedule a live demo

Thirty minutes. Your questions answered with dashbaords and reports.
We’ll follow up within one business day.

Frequently asked questions

Still curious? Ask us anything in the demo.

Do we need a server or a BIM manager?

No. Studio is fully hosted by Bimbeats on Elastic Cloud. You do not need to set up any additional infrastructure. If you can run an installer, you can run Studio.

Do we need a server or a BIM manager?

Is this monitoring my employees?

Studio measures how work flows, model health, wait times, and how time splits across programs. We do not collect keystrokes or screenshots.

Is this monitoring my employees?

How fast will we see data?

Same day. As soon as the installer runs, data starts flowing and your dashboards begin to populate automatically. Your first weekly report arrives the following Monday.

How fast will we see data?

What exactly does Studio collect?

Three feeds: Revit activity and model health, program usage (which applications your team spends time in), and machine health (hardware and software versions).

What exactly does Studio collect?

We have more than 50 people — can we get Studio?

Studio is capped at 49 machines by design. At that size you’ll get more from the full Bimbeats platform: every data source, custom dashboards, and your own infrastructure. Book a demo and we can discuss which solution is best for your team.

We have more than 50 people — can we get Studio?

What’s not included?

Customozable dashboards, additional data sources (Navisworks, AutoCAD, ACC and more), and self-hosting are enterprise features. Studio’s fixed scope is what keeps it simple and affordable.

What’s not included?